In the previous post we examined how the maxima model can be applied to the SP500 dataset using quarterly and monthly blocks. A more modern and comprehensive approach involves fitting an appropriate threshold model to the data rather than dividing the entire dataset into quarters or months.
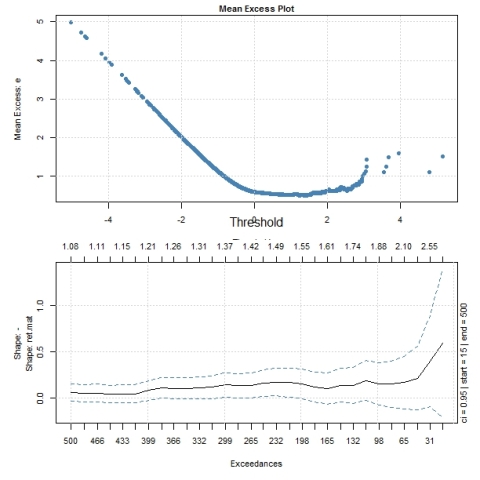
Before we can fit the model,we must determine the suitable threshold to use. This can be assessed by visual inspection of mean excess plots and/or gpd shape plots from the library. The mean excess plot becomes linear and upward sloping at around a threshold of u=1, which we can then use as an input to fitting the gpd model. Diagnostic plots suggest that the GPD model is quite suitable to modelling the returns data.
# Mean excessplot (Lower Tail)
# Me plot tells us the threshold u.Threshold occurs when meplot starts to be linear
# linear and + slope -> fat tails
# linear and - sloke -> thin tails

windows()
layout(c(1,1,2,2))
par(mai=c(0.5,0.75,0.2,0.3))
par(cex.main=0.85,cex.lab=0.85,cex=0.75,cex.axis=0.85)
mePlot(-ret.mat)
par(mai=c(0.75,0.75,0.3,0.3))
gpdShapePlot(-ret.mat,plottype='reverse')   # Fat tails if : shape parameter xi increases as threshholds increase/

GPD.fit.low<-gpdFit(-ret.mat,u=1)

# diagnostics
windows()
layout(matrix(c(1,2,3,4),nrow=2,ncol=2))
par(mai=c(0.75,0.75,0.75,0.5),cex.main=0.85,cex.lab=0.85,cex=0.75,cex.axis=0.85,bty='n')
for(i in 1:4){
  plot(GPD.fit.low,which=i)
}
Created by Pretty R at inside-R.org
hh
ggg
Now that we have fitted a threshold model to the SP500 returns data, we can use this GPD distribution to calculate extreme risk measures such as VaR and Expected shortfall. The following section compares these risk measures under a normality assumption versus the fitted GPD distribution.
# Risk measures VaR , Eshortfall
quantiles<-round(seq(0.95,0.99,length=100),4)

Norm.risk<-round(Riskmeasures.Normal(-ret.mat,quantiles),4)
Norm.risk.quantiles<-Norm.risk[,1]
Norm.risk.probs<-(1-Norm.risk[,1])*100
Norm.risk.VaR<-Norm.risk[,2]
Norm.risk.Es<-Norm.risk[,3]

GPD.risk<-round(gpdRiskMeasures(GPD.fit.low,p=quantiles),4)
GPD.risk.quantiles<-GPD.risk[,1]
GPD.risk.probs<-(1-GPD.risk[,1])*100
GPD.risk.VaR<-GPD.risk[,2]
GPD.risk.Es<-GPD.risk[,3]

windows()
par(mai=c(0.75,0.75,0.75,0.5),cex.main=0.95,cex.lab=0.85,cex=0.75,cex.axis=0.85)
plot(main="Value-at-risk and Expected-Shortfall \n under normality and Generalised Pareto Distribution for the tails",ylab="Risk",xlab="Probabilites",type='l',x=GPD.risk.probs,y=GPD.risk.VaR,ylim=c(min(GPD.risk),max(GPD.risk)),lwd=2,col="steelblue")
lines(x=GPD.risk.probs,y=GPD.risk.Es,type='l',col="darkblue",lwd=2)
lines(x=Norm.risk.probs,y=Norm.risk.VaR,col="green",lwd=2)
lines(x=Norm.risk.probs,y=Norm.risk.Es,col="darkgreen",lwd=2)
text(cex=1,max(GPD.risk.probs)-0.5,y=GPD.risk[max(GPD.risk.probs),2]-0.05,"GPD \n Value At Risk",font=2,col="steelblue")
text(cex=1,x=max(GPD.risk.probs)-0.5,y=GPD.risk[max(GPD.risk.probs),3]+0.16,"GPD \n Expected shortfall",font=2,col="darkblue")
text(cex=1,max(GPD.risk.probs)-0.5,y=GPD.risk[max(GPD.risk.probs),2]+0.16,"Norm \n Value At Risk",font=2,col="green")
text(cex=1,x=max(GPD.risk.probs)-0.5,y=GPD.risk[max(GPD.risk.probs),3]-0.18,"Norm \n Expected shortfall",font=2,col="darkgreen")

# Example interpretation
mid.prob<-mean(GPD.risk.probs)
mid.quant<-1-(mid.prob/100)
mid.VaR<-last(GPD.risk[GPD.risk[,1]<=mid.quant,2])
mid.Es<-last(GPD.risk[GPD.risk[,1]<=mid.quant,3])

abline(v=mid.prob,lwd=1,lty="dashed")
abline(h=mid.VaR,lwd=1,lty="dashed")
abline(h=mid.Es,lwd=1,lty="dashed")

points(mid.prob,mid.VaR,col="darkred",cex=2,pch=20)
points(mid.prob,mid.Es,col="darkred",cex=2,pch=20)

text(x=1.8,y=1.25,labels=paste("[Value at Risk] \n \n With a probability of",mid.prob,"percent"),font=2)
text(x=1.8,y=1.10,labels=paste("The daily return can be as \n low as",-mid.VaR,"percent"),font=2)

text(x=4.05,y=2.5,labels=paste("[Expected Shortfall] \n \n With a return less then",-mid.VaR,"percent"),font=2)
text(x=4,y=2.35,labels=paste("the average daily return is \n ",-mid.Es,"percent"),font=2)
mtext(side=3,"VaR and Es measures under Normality are underestimated relative to the GPD case",col='darkblue',font=2,cex=0.75)

#Results summary
tab.fill1<-c("",symbols,paste(beg,'-',ed),p.n.obs,ret.type)
tab.ind<-c("","Symbol","Date Range","Observations","Return Type")
dat.tab<-cbind(tab.ind,tab.fill1)
rownames(dat.tab)<-c("","","Dataset\n used","","")

temp<-GEV.Quarters
temp.n<-temp@fit$n
temp.xi<-round(temp@fit$par.ests[1],2)
temp.mu<-round(temp@fit$par.ests[2],2)
temp.beta<-round(temp@fit$par.ests[3],2)
temp.alpha<-round(1/temp.beta,2)
temp.xi.se<-round(temp@fit$par.ses[1],2)
temp.mu.se<-round(temp@fit$par.ses[2],2)
temp.beta.se<-round(temp@fit$par.ses[3],2)
temp.alpha.se<-c('***')
temp.prob<-paste(round(Quarters.prob[1],4)*100,"%")
temp.xi.t<-round(temp.xi/temp@fit$par.ses[1],2)
temp.mu.t<-round(temp.mu/temp@fit$par.ses[2],2)
temp.beta.t<-round(temp.beta/temp@fit$par.ses[3],2)
temp.alpha.t<-c('***')
# temp.interp<-ifelse(temp.xi<0,"Weibull Distribution which is thin tailed",ifelse(temp.xi==0,"Gumbel Distribution","Frechet Distribution which is fat-tailed"))

temp.m<-GEV.Monthly
temp.n.m<-temp.m@fit$n
temp.xi.m<-round(temp.m@fit$par.ests[1],2)
temp.mu.m<-round(temp.m@fit$par.ests[2],2)
temp.beta.m<-round(temp.m@fit$par.ests[3],2)
temp.alpha.m<-round(1/temp.beta.m,2)
temp.xi.se.m<-round(temp.m@fit$par.ses[1],2)
temp.mu.se.m<-round(temp.m@fit$par.ses[2],2)
temp.beta.se.m<-round(temp.m@fit$par.ses[3],2)
temp.alpha.se.m<-c('***')
temp.prob.m<-paste(round(Months.prob[1],4)*100,"%")
temp.xi.t.m<-round(temp.xi/temp.m@fit$par.ses[1],2)
temp.mu.t.m<-round(temp.mu/temp.m@fit$par.ses[2],2)
temp.beta.t.m<-round(temp.beta/temp.m@fit$par.ses[3],2)
temp.alpha.t.m<-c('***')
# temp.interp.m<-paste("The maximal returns in\nmonthly blocks follow a",ifelse(temp.xi.m<0,"Weibull Distribution which is thin tailed",ifelse(temp.xi.m==0,"Gumbel Distribution","Frechet Distribution which is fat-tailed")))

temp.g<-GPD.fit.low
temp.n.g<-length(temp.g@fit$data)
temp.thr.g<-temp.g@fit$threshold
temp.xi.g<-round(temp.g@fit$par.ests[1],2)
temp.beta.g<-round(temp.g@fit$par.ests[2],2)
temp.xi.se.g<-round(temp.g@fit$par.ses[1],2)
temp.beta.se.g<-round(temp.g@fit$par.ses[2],2)
temp.xi.t.g<-round(temp.xi.g/temp.g@fit$par.ses[1],2)
temp.beta.t.g<-round(temp.beta.g/temp.g@fit$par.ses[2],2)
temp.interp.g<-c('asasd')
temp.VaR<-GPD.risk.VaR[1]
temp.Es<-GPD.risk.Es[1]
# temp.interp.g<-paste("The threshold excess returns\nfollow a",ifelse(temp.xi.g<0,"Weibull Distribution which is thin tailed",ifelse(temp.xi.g==0,"Gumbel Distribution","Frechet Distribution which is fat-tailed")))

gev.fill1<-c("Observations","xi(shape)","mu(location)","beta(scale)","alpha(tailindex)","PROB","----------------","Observations","xi(shape)","mu(location)","beta(scale)","alpha(tailindex)","PROB","----------------","Observations","Threshold","xi(shape)","beta(scale)","VaR","Es")
gev.fill2<-c(temp.n,temp.xi,temp.mu,temp.beta,temp.alpha,temp.prob,"--------",temp.n.m,temp.xi.m,temp.mu.m,temp.beta.m,temp.alpha.m,temp.prob.m,"--------",temp.n.g,temp.thr.g,temp.xi.g,temp.beta.g,temp.VaR,temp.Es)
gev.fill3<-c(" ",temp.xi.se,temp.mu.se,temp.beta.se,temp.alpha.se,' ',"-------"," ",temp.xi.se.m,temp.mu.se.m,temp.beta.se.m,temp.alpha.se.m,' ',"-------"," "," ",temp.xi.se.g,temp.beta.se.g," "," ")
gev.fill4<-c(" ",temp.xi.t,temp.mu.t,temp.beta.t,temp.alpha.t,' ',"-------"," ",temp.xi.t.m,temp.mu.t.m,temp.beta.t.m,temp.alpha.t.m,' ',"-------"," "," ",temp.xi.t.g,temp.beta.t.g,' '," ")
gev.tab<-cbind(gev.fill1,gev.fill2,gev.fill3,gev.fill4)
colnames(gev.tab)<-c("Estimates","Values","Std.Errors","T-value")
rownames(gev.tab)<-c("Quarterly\nBlock Maxima"," "," "," "," ","Risk Measures"," ------------------------------","Monthly\nBlock Maxima"," "," "," "," ","Risk Measures"," ------------------------------","Value over\nThreshold"," "," "," "," ","Risk Measures")

windows()
layout(c(1,2,2,2))
textplot(col.rownames="darkblue",show.colnames=F,dat.tab,cex=1,valign='bottom',halign='center',col.colnames="darkblue")
textplot(col=ifelse((gev.tab=='PROB' | gev.tab=='VaR' | gev.tab=='Es'),'darkred','black'),col.colnames="darkblue",col.rownames=ifelse(rownames(gev.tab)=='Risk Measures','darkred',"darkblue"),gev.tab,cex=1,valign='top',halign='left')
Created by Pretty R at inside-R.org
hghh
The following plot shows how VaR/ES measures vary across Distributions (Normal vs GPD) along probability levels. The results corroborate the intuition that extreme risk measures are underestimated in the case a normality assumption is imposed as opposed to the case where we use the more accurate GPD distribution to model the tails.
Finally I have summarised the findings in the following table.


