Archive

Tag Archives: AIC

The previous post ended with the creation of a matrix that contains an unlisted version of the selection criteria for each fund & model combination. From this object let’s create three data frames which we then manipulate and use as data inputs to the ggplot function.

[6] Make a facet plot of Selection Criteria across non-problematic funds

Here we simply make a dodged barchart plot for both AIC and SBC criteria across the 9 remaining non-problematic funds.

#ggplot across all funds
df.1 <- data.frame(Fund=rep(subfund.names,n.models),AIC=as.numeric(temp[,1]),SBC=as.numeric(temp[,2]),Model=temp[,5],stringsAsFactors=T)
df.1<-gather(df.1,Selection.Criteria,values,-c(Fund,Model))
miny <- min(df.1[,'values'])
maxy <- max(df.1[,'values'])

all.plot <- ggplot(data = df.1)+
	 						geom_bar(aes(x=Model,y=values,fill=Selection.Criteria),stat = "identity",position='dodge')+
	 						scale_fill_brewer(palette='Set1')+
	 						theme(axis.text.x = element_text(angle=90, hjust=1),legend.position='bottom',legend.key.size=unit(0.2, "cm"),legend.key.width=unit(2,'cm'),legend.direction='horizontal')+
	 						labs(title='Comparison of Selection Information for Lognormal, Autoregressive, \nand Regime Switching Models across Funds')+
	 						facet_wrap(~Fund,shrink=T)+
	 						coord_cartesian(ylim=c(miny,maxy+1))

l
nnnn

Interpretation of the selection criteria is straightforward : the higher the value the better the model. Although model differences are not very significant within each fund,the values for the selection criteria do show some variation across funds (thankfully). Models seem to do particularly well for the Equity.Market.Neutral and Fixed.Income.Arbitrage cases.

To gain a better view of how individual models performed,let’s take a look at the results for a particular fund & selection criterion combination.

[7] Snap plot function for the chosen fund and selection criterion

The FundSnap() function provides [1] a dodged barchart plot of models ranked according to the selected criterion (AIC,SBC) in descending order as well as [2]  a tabulation of numeric values (Likelihood,degree of freedom,AIC,SBC) with maximum/minimum values highlighted.

########################################################################################
# Fund snap across models
########################################################################################

FundSnap <- function(fund,df.obj,order.by){

	e<-environment()

	tbl.df <- df.obj%>%
		        filter(Fund==fund)%>%
		        select(Model,DF,Likelihood,AIC,SBC)

  temp.sel <- paste('df.obj$',order.by,sep='')

	plot.df <- df.obj%>%
		         arrange(desc(eval(parse(text=temp.sel))))%>%
		         filter(Fund==fund)%>%
		         select(c(Fund,Model,eval(parse(text=order.by))))

#plot
	miny<-min(plot.df[,3])
	maxy <-max(plot.df[,3])

	snap.plot <- ggplot(data = plot.df,environment=e)+theme_tufte()+
	 					 			geom_bar(aes(x=reorder(Model,desc(eval(parse(text=order.by)))),y=eval(parse(text=order.by)),fill=(eval(parse(text=order.by)))),stat = "identity",position='dodge',alpha=0.4)+
	 	              scale_fill_continuous(low="lightgreen", high="darkgreen")+
		              coord_cartesian(ylim=c(miny-1,maxy+1))+
		              theme(legend.position='none',legend.key.size=unit(0.2, "cm"),legend.key.width=unit(2,'cm'),legend.direction='horizontal',axis.text.x = element_text(angle=90, hjust=1),panel.grid.major = element_blank(), panel.grid.minor = element_blank())+
		              labs(title=paste('Snapshot for : ',fund,' & ',order.by,'\nacross models',sep=''))+
		              xlab('Models')+
		              ylab('Values')

#table
	tbl.df$Model <- as.character(tbl.df$Model)
	tbl.df$Likelihood <- round(tbl.df$Likelihood,2)
	tbl.df$AIC <- round(tbl.df$AIC,2)
	tbl.df$SBC <- round(tbl.df$SBC,2)

	parse.str <- paste('tbl.df$',order.by,sep='')
  row.max.idx <- which(eval(parse(text=parse.str))==max(eval(parse(text=parse.str))))
  row.min.idx <- which(eval(parse(text=parse.str))==min(eval(parse(text=parse.str))))

	debug.spec <- ggTableSpec(columns.exist=T,columns.txt=colnames(tbl.df),columns.font=rep('bold',ncol(tbl.df)),columns.col='blue',columns.fill='grey',columns.alpha=0.7,
		                      rows.exist=F,rows.txt=paste('row',1:10,sep=''),rows.font=rep('bold',10),rows.col='green',rows.fill='grey',rows.alpha=0.7,
		                      data.obj=tbl.df,
		                    	hlt.col.exist=T,hl.col.which=c(row.min.idx,row.max.idx),hl.col.fill=c('lightgreen','darkgreen'),hl.col.alpha=c(0.4,0.4),
		                    	hlt.row.exist=F,hl.row.which=row.idx,hl.row.fill='skyblue',hl.row.alpha=0.45
                )
  tbl.plot <- ggTableDrawer(debug.spec)

	layOut(
		     list(snap.plot,1,1),
		     list(tbl.plot,2,1)
	)
}
########################################################################################

ll

Implementation is simple once we have the proper data frame in place:

#ggplot for specific funds
df.2 <- data.frame(Fund=rep(subfund.names,n.models),DF=as.numeric(temp[,3]),Likelihood=as.numeric(temp[,4]),AIC=as.numeric(temp[,1]),SBC=as.numeric(temp[,2]),Model=temp[,5],stringsAsFactors=T)
FundSnap(fund='Emerging.Markets',df.obj=df.2,order.by='SBC')

l
hhhh

Above shows the case of the Emerging.Markets & SBC combination.The AR.GARCH model provides the maximal SBC value while the ILN.Reg3 model is least useful here.

[8] Percentage of funds for which a model has maximal AIC

The final plot is a bar chart plot with text annotations showing how often a particular model is the best performer across the remaining non problematic funds.

#Percentages
df.3 <- data.frame(Fund=rep(subfund.names,n.models),AIC=as.numeric(temp[,1]),Model=temp[,5],stringsAsFactors=T)
df.3 <- spread(df.3,Model,AIC)

col.idx <- apply(df.3,1,function(x) which(x==max(x[-1]),arr.ind=TRUE))
col.names <- colnames(df.3)[col.idx]

df.percentages <- df.3%>%
										mutate(Best.Model=col.names)%>%
                    group_by(Best.Model)%>%
                    summarise(count=n()/length(df.3)*100)

perc.plot <- ggplot(data = df.percentages)+
	 							geom_bar(aes(x=Best.Model,y=count,fill=Best.Model),stat = "identity",position='dodge')+
	 							scale_fill_brewer(palette='Set1')+
	 							theme(axis.text.x = element_blank(),legend.position='bottom',legend.key.size=unit(0.2, "cm"),legend.key.width=unit(2,'cm'),legend.direction='horizontal')+
	 							labs(title='Best performing models')+
                geom_text(aes(x=Best.Model,y=count/2,label=paste(round(count,2),'%',sep=''),fontface=rep('bold',4)),size=rel(4))+
	 							xlab('')+
	 							ylab('Percentage')

ll

gh

It appears that the AR.GARCH and ILN.Reg3 models provide the highest AIC values a third of the time.The simplest model,the independent log normal model fares relatively badly in comparison. Complicated models do seem to work better in our data.

Continuing with the list of tasks defined in the previous post, let’s load the edhec data set,fit each of the nine models to each of the funds and store results in a nested list object :

[4] Load data and store results

For each model and fund combination, I store the following information :

  1. The Log-Likelihood value
  2. The Degree of freedom
  3. The AIC criterion
  4. The SBC criterion

The code follows :

########################################################################################
# Load dataset
########################################################################################

orig.csv <- read.csv('edhecfinal.csv',header=T,stringsAsFactors=F)
edhec.xts <- xts(order.by=seq(as.Date('1997-01-31'),as.Date('2014-07-31'),by='1 month'),orig.csv[,-1])
edhec.xts <- log(edhec.xts+1)

########################################################################################
# Nested Lists and Regression results
########################################################################################

n.funds <- ncol(edhec.xts)
fund.names <- names(edhec.xts)
n.obs <- nrow(edhec.xts)

n.models <- 9

edhec.ret <- list()
	for(i in 1:n.funds){
		edhec.ret[[i]] <- list()
		names(edhec.ret)[i] <- fund.names[i]
		edhec.ret[[i]]$Ret.xts <- edhec.xts[,i]
    logret <- Return.clean(edhec.ret[[i]]$Ret.xts,method='boudt')

			#Independent Log-normal model
			edhec.ret[[i]]$ILN <- lm(logret~1)
		  edhec.ret[[i]]$ILN$Stat <- StatComp(edhec.ret[[i]]$ILN,n.obs)

		  edhec.ret[[i]]$ILN$LogLik <- edhec.ret[[i]]$ILN$Stat['model.loglik']
		  edhec.ret[[i]]$ILN$df <- edhec.ret[[i]]$ILN$Stat['model.df']
		  edhec.ret[[i]]$ILN$AIC <- edhec.ret[[i]]$ILN$Stat['model.aic']
		  edhec.ret[[i]]$ILN$SBC <- edhec.ret[[i]]$ILN$Stat['model.sbc']

		  #Autoregressive model
		  edhec.ret[[i]]$AR1 <- arima(x=logret,order=c(1,0,0))
		  edhec.ret[[i]]$AR1$Stat <- StatComp(edhec.ret[[i]]$AR1,n.obs)

		  edhec.ret[[i]]$AR1$LogLik <- edhec.ret[[i]]$AR1$Stat['model.loglik']
		  edhec.ret[[i]]$AR1$df <- edhec.ret[[i]]$AR1$Stat['model.df']
		  edhec.ret[[i]]$AR1$AIC <- edhec.ret[[i]]$AR1$Stat['model.aic']
		  edhec.ret[[i]]$AR1$SBC <- edhec.ret[[i]]$AR1$Stat['model.sbc']

		  #ARCH model
			arch.spec <- ugarchspec(variance.model=list(garchOrder=c(1,0)),mean.model = list(armaOrder=c(0,0)))
		  arch.fit<- ugarchfit(spec=arch.spec, data=logret,solver.control=list(trace = 1))

		  edhec.ret[[i]]$ARCH$LogLik <- likelihood(arch.fit)
		  edhec.ret[[i]]$ARCH$df <- 3
		  edhec.ret[[i]]$ARCH$AIC <- edhec.ret[[i]]$ARCH$LogLik-edhec.ret[[i]]$ARCH$df
		  edhec.ret[[i]]$ARCH$SBC <- edhec.ret[[i]]$ARCH$LogLik-0.5*edhec.ret[[i]]$ARCH$df*log(n.obs)

	    #AR-ARCH model
			arch.spec <- ugarchspec(variance.model=list(garchOrder=c(1,0)),mean.model = list(armaOrder=c(1,0)))
		  arch.fit<- ugarchfit(spec=arch.spec, data=logret,solver.control=list(trace = 1))

		  edhec.ret[[i]]$AR.ARCH$LogLik <- likelihood(arch.fit)
		  edhec.ret[[i]]$AR.ARCH$df <- 4
		  edhec.ret[[i]]$AR.ARCH$AIC <- edhec.ret[[i]]$AR.ARCH$LogLik-edhec.ret[[i]]$AR.ARCH$df
		  edhec.ret[[i]]$AR.ARCH$SBC <- edhec.ret[[i]]$AR.ARCH$LogLik-0.5*edhec.ret[[i]]$AR.ARCH$df*log(n.obs)

	    #GARCH model
			garch.spec <- ugarchspec(variance.model=list(garchOrder=c(1,1)),mean.model = list(armaOrder=c(0,0)))
		  garch.fit<- ugarchfit(spec=garch.spec, data=logret,solver.control=list(trace = 1))

		  edhec.ret[[i]]$GARCH$LogLik <- likelihood(garch.fit)
		  edhec.ret[[i]]$GARCH$df <- 4
		  edhec.ret[[i]]$GARCH$AIC <- edhec.ret[[i]]$GARCH$LogLik-edhec.ret[[i]]$GARCH$df
		  edhec.ret[[i]]$GARCH$SBC <- edhec.ret[[i]]$GARCH$LogLik-0.5*edhec.ret[[i]]$GARCH$df*log(n.obs)

		  #AR-GARCH model
			garch.spec <- ugarchspec(variance.model=list(garchOrder=c(1,1)),mean.model = list(armaOrder=c(1,0)))
		  garch.fit<- ugarchfit(spec=garch.spec, data=logret,solver.control=list(trace = 1))

		  edhec.ret[[i]]$AR.GARCH$LogLik <- likelihood(garch.fit)
		  edhec.ret[[i]]$AR.GARCH$df <- 5
		  edhec.ret[[i]]$AR.GARCH$AIC <- edhec.ret[[i]]$AR.GARCH$LogLik-edhec.ret[[i]]$AR.GARCH$df
		  edhec.ret[[i]]$AR.GARCH$SBC <- edhec.ret[[i]]$AR.GARCH$LogLik-0.5*edhec.ret[[i]]$AR.GARCH$df*log(n.obs)

		  #ILN 2 regimes
		  model.spec <- depmix(eval(parse(text=fund.names[i]))~1,nstates=2,data=logret)
	    model.fit <- fit(model.spec)
		  edhec.ret[[i]]$ILN.Reg2$Stat <- StatComp(model.fit,n.obs)

      edhec.ret[[i]]$ILN.Reg2$LogLik <- edhec.ret[[i]]$ILN.Reg2$Stat['model.loglik']
		  edhec.ret[[i]]$ILN.Reg2$df <- edhec.ret[[i]]$ILN.Reg2$Stat['model.df']
		  edhec.ret[[i]]$ILN.Reg2$AIC <- edhec.ret[[i]]$ILN.Reg2$Stat['model.aic']
		  edhec.ret[[i]]$ILN.Reg2$SBC <- edhec.ret[[i]]$ILN.Reg2$Stat['model.sbc']

	    #ILN 3 regimes
		  model.spec <- depmix(eval(parse(text=fund.names[i]))~1,nstates=3,data=logret)
	    model.fit <- fit(model.spec)
	  	edhec.ret[[i]]$ILN.Reg3$Stat <- StatComp(model.fit,n.obs)

      edhec.ret[[i]]$ILN.Reg3$LogLik <- edhec.ret[[i]]$ILN.Reg3$Stat['model.loglik']
		  edhec.ret[[i]]$ILN.Reg3$df <- edhec.ret[[i]]$ILN.Reg3$Stat['model.df']
		  edhec.ret[[i]]$ILN.Reg3$AIC <- edhec.ret[[i]]$ILN.Reg3$Stat['model.aic']
		  edhec.ret[[i]]$ILN.Reg3$SBC <- edhec.ret[[i]]$ILN.Reg3$Stat['model.sbc']

      #AR-Regime switch model
		  temp.df <- data.frame(logret[2:n.obs],logret[2:n.obs-1])
		  names(temp.df) <- c('left','right')

		  model.spec <- depmix(left~right,nstates=2,data=temp.df)
	    model.fit <- fit(model.spec)

			edhec.ret[[i]]$AR.Reg2$Stat <- StatComp(model.fit,n.obs)

      edhec.ret[[i]]$AR.Reg2$LogLik <- edhec.ret[[i]]$AR.Reg2$Stat['model.loglik']
		  edhec.ret[[i]]$AR.Reg2$df <- edhec.ret[[i]]$AR.Reg2$Stat['model.df']
		  edhec.ret[[i]]$AR.Reg2$AIC <- edhec.ret[[i]]$AR.Reg2$Stat['model.aic']
		  edhec.ret[[i]]$AR.Reg2$SBC <- edhec.ret[[i]]$AR.Reg2$Stat['model.sbc']

	}

l
To give an idea of the output,consider the case of CTA.Global fund and the Autoregressive-Regime switching model :

ff


The StatComp() function used to calculate these values is simply :

########################################################################################
# Calculating Stats for Comparison across models
########################################################################################

StatComp <- function(fitted.model,n.obs){
	    model.df <- attr(logLik(fitted.model),which='df')
			model.loglik <- as.numeric(logLik(fitted.model))
		  model.aic <- model.loglik-model.df
		  model.sbc <- model.loglik-0.5*model.df*log(n.obs)

	return(c(model.df=model.df,model.loglik=model.loglik,model.aic=model.aic,model.sbc=model.sbc))
}

ll
Once we have fitted each of the nine models to the data for each of the 13 funds in the edhec dataset,let’s summarise this information in a new list object by saving across models.


[5] Saving across models and making data ggplot friendly

The purpose of this step in the process is to summarise the data contained in the edhec.ret list object above into something that can be conveniently used in ggplot functions. Problematic funds are subsequently identified and deleted.

# Saving across models & removing problematic funds
model.names <- names(edhec.ret[[1]])[-1]
model.list <- list()
problems <- NULL

for(i in 1:n.models){
	model.list[[i]] <- list()
	names(model.list)[i] <- model.names[i]
	model.list[[i]] <- do.call(rbind,lapply(edhec.ret,function(x) eval(parse(text=paste('x$',model.names[i],sep='')))))[,c('AIC','SBC','df','LogLik')]
  problems <- c(problems,which(is.na(model.list[[i]]==0) | model.list[[i]]<0))
  model.list[[i]] <- cbind(model.list[[i]],Model=rep(model.names[i],n.funds))
}

problem.funds <- unique(problems)[-which(problems>13)][-5]
model.list<-lapply(model.list,function(x) x[-problem.funds,])
subfund.names <- rownames(model.list[[1]])

temp <- apply(do.call(rbind,model.list),2,unlist)

ll
By problematic funds, i mean those for which the following error messages occurred in the fitting process:

gff


For me the problematic funds are the ones corresponding to the following indices :

kli


Ultimately,our model.list object looks like this :

jjuk


This is the first element of the list. It continues this way for all other models listed in the previous post. The last line of code creates a matrix called temp which contains the unlisted version of the data contained in model.list. In the next post we will use this temp object to create three data frames, each of which we will manipulate using the tidyR package to produce the desired data structure for ggplotting purposes.

In my attempt to replicate some of the methodologies of the Kritzman paper, I stumbled across an article by Hardy (2001) which I thought I might try to tinker with as well. To summarise :  the paper itself is concerned with the following issues [1] A comparison of the fit of Regime Switching Log Normal (RSLN) model with other conventional models in common use for the SP500 / TSE 300 indices ; [2] Derivation of the distribution function for the RSLN model ; [3] Derivation of the European option price using the RSLN model ; [4] Application of the model to calculate risk measures.

As usual I only replicate the most basic issues,in this case a comparison of the fit across a host of models on the basis of the edhec data series from previous blog entries (as opposed to the broad market indices used in the paper).

To make this write up easier on me, this and subsequent posts shall deal with the following tasks :

  1. Provide a summary of the models examined by the paper.
  2. Provide a summary of the selection criteria (used to rank fitted results across models within and across fund returns).
  3. Attempt to make a custom ggplot table maker function to simplify text plotting.
  4. Load the edhec data set and store model results in a nested list object such that :
    • We fit 9 models to each of the 13 funds in the data set.
    • We store the estimated parameters and calculate values for chosen selection criteria for each model & fund combination.
    • We can access ILN model in fund CTA.Global by : Nested_List$CTA.Global$ILN.
  5. Save across models & remove problematic funds (funds that had strange values in the fitting process)  such that :
    •  We have a list object of 9 elements :
      • with each element being named after one of the 9 models.
      • with each element containing a data frame of non problematic funds and their selection criteria, formatted in a ggplot friendly way.
  6. Make a facet plot of Selection Criteria across non-problematic funds of the edhec dataset.
  7. Make a snap plot function for the chosen fund and selection criteria such that :
    • We provide a ranking of models for the particular fund and selection criteria combination in tabular as well as graphic form.
  8. Make a plot showing how often each model is the best performer across non-problematic funds.


[1] Summary of the models used

(1) The Independent Log Normal Model (ILN)

s1

(2) The First-order autoregressive model (AR1)

s2

(3) The autoregressive conditionally heteroskedastic model (ARCH1)

s3

(4) Combination of AR and ARCH model (AR.ARCH)

s4

(5) The generalized autoregressive conditionally heteroskedastic model (GARCH)

s5

(6) Combination of AR and GARCH model (AR.GARCH)

s7

(7) Regime Switching AR(1) model (AR.Reg2)

s8

(8) Regime Switching ILN model with 2 regimes (ILN.Reg2)

(9) Regime Switching ILN model with 3 regimes (ILN.Reg3)


[2] Summary of the Selection Criteria used

While the paper uses the (1) Likelihood ratio test, (2) Akaike Information Criterion and (3) Schwartz Bayes Criterion, I only used the the last two. The AIC uses the model that maximises the difference between the likelihood and the degree of freedom. The SBC uses the model that maximises the following :

lm

where I is the likelihood ; k the degree of freedom ; n the sample size ; j represents the model.


[3] Custom ggplot Table Maker

Since it is often useful to be able to plot tabular data on the fly,I have written a simple function for this purpose which allows one to specify typical elements of a basic table :

  • Is there a column and/or row?
  • What is the column title and/or row title?
  • What is the font for these titles?
  • What is the colour of the background of those titles?
  • What is the alpha value?
  • Is there a highlight for the column and/or row?
  • Which column and/or row should be highlighted?
  • What are the colours and alpha values for each highlight?

Mine is of course a fairly naive implementation,hardcoding certain coordinate adjustments instead of dynamically scaling them somehow (don’t know how) and only useful when there are not too many/little rows and columns. In any case,usage is fairly simple :

  1. Specify elements using the ggTableSpec function.
  2. Draw table using the ggTableDrawer function.

l

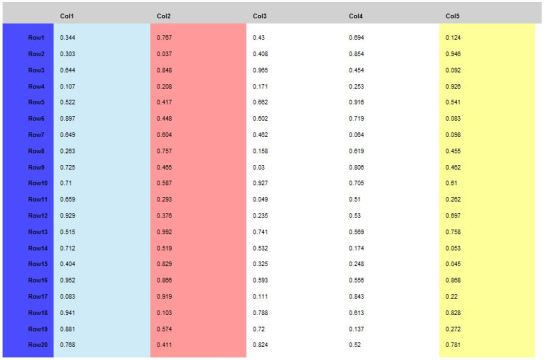
Example 1 : No highlighting whatsoever

l

  smpl.data <- data.frame(Col1=round(runif(20),3),Col2=round(runif(20),3),Col3=round(runif(20),3),Col4=round(runif(20),3),Col5=round(runif(20),3))
  rownames(smpl.data) <- paste('Row',1:20,sep='')

	smpl.spec <- ggTableSpec(columns.exist=T,columns.txt=colnames(smpl.data),columns.font=rep('bold',ncol(smpl.data)),columns.col='blue',columns.fill='grey',columns.alpha=0.7,
		                      rows.exist=T,rows.txt=rownames(smpl.data),rows.font=rep('bold',10),rows.col='green',rows.fill='blue',rows.alpha=0.7,
		                      data.obj=smpl.data,
		                    	hlt.col.exist=F,hl.col.which=c(1,5,20),hl.col.fill=c('lightgreen','darkgreen','red'),hl.col.alpha=c(0.4,0.4,0.4),
		                    	hlt.row.exist=F,hl.row.which=c(1,2,5),hl.row.fill=c('skyblue','red','yellow'),hl.row.alpha=c(0.4,0.4,0.4)
                )
  ggTableDrawer(smpl.spec)

a1


Example 2 : Column Highlighting
l

  smpl.data <- data.frame(Col1=round(runif(20),3),Col2=round(runif(20),3),Col3=round(runif(20),3),Col4=round(runif(20),3),Col5=round(runif(20),3))
  rownames(smpl.data) <- paste('Row',1:20,sep='')

	smpl.spec <- ggTableSpec(columns.exist=T,columns.txt=colnames(smpl.data),columns.font=rep('bold',ncol(smpl.data)),columns.col='blue',columns.fill='grey',columns.alpha=0.7,
		                      rows.exist=T,rows.txt=rownames(smpl.data),rows.font=rep('bold',10),rows.col='green',rows.fill='blue',rows.alpha=0.7,
		                      data.obj=smpl.data,
		                    	hlt.col.exist=F,hl.col.which=c(1,5,20),hl.col.fill=c('lightgreen','darkgreen','red'),hl.col.alpha=c(0.4,0.4,0.4),
		                    	hlt.row.exist=T,hl.row.which=c(1,2,5),hl.row.fill=c('skyblue','red','yellow'),hl.row.alpha=c(0.4,0.4,0.4)
                )
  ggTableDrawer(smpl.spec)

a2

Some alignment issues for the last column there.


Example 3 : Row Highlighting
l

  smpl.data <- data.frame(Col1=round(runif(20),3),Col2=round(runif(20),3),Col3=round(runif(20),3),Col4=round(runif(20),3),Col5=round(runif(20),3))
  rownames(smpl.data) <- paste('Row',1:20,sep='')

	smpl.spec <- ggTableSpec(columns.exist=T,columns.txt=colnames(smpl.data),columns.font=rep('bold',ncol(smpl.data)),columns.col='blue',columns.fill='grey',columns.alpha=0.7,
		                      rows.exist=T,rows.txt=rownames(smpl.data),rows.font=rep('bold',10),rows.col='green',rows.fill='blue',rows.alpha=0.7,
		                      data.obj=smpl.data,
		                    	hlt.col.exist=T,hl.col.which=c(1,5,20),hl.col.fill=c('lightgreen','darkgreen','red'),hl.col.alpha=c(0.4,0.4,0.4),
		                    	hlt.row.exist=F,hl.row.which=c(1,2,5),hl.row.fill=c('skyblue','red','yellow'),hl.row.alpha=c(0.4,0.4,0.4)
                )
  ggTableDrawer(smpl.spec)

a3

Again some alignment problems at the top and bottom. Maybe I will correct these issues later,for the time being I do not care. My suspicion is that the extreme coordinates for the column and row title panels are -/+ Inf whereas the coordinates for the highlights are not,hence their alignment should not be expected. Changing the Inf values to concrete ones should do the trick (maybe).


Example 4 : Row and Column Highlighting
l

 smpl.data <- data.frame(Col1=round(runif(20),3),Col2=round(runif(20),3),Col3=round(runif(20),3),Col4=round(runif(20),3),Col5=round(runif(20),3))
  rownames(smpl.data) <- paste('Row',1:20,sep='')

	smpl.spec <- ggTableSpec(columns.exist=T,columns.txt=colnames(smpl.data),columns.font=rep('bold',ncol(smpl.data)),columns.col='blue',columns.fill='grey',columns.alpha=0.7,
		                      rows.exist=T,rows.txt=rownames(smpl.data),rows.font=rep('bold',10),rows.col='green',rows.fill='blue',rows.alpha=0.7,
		                      data.obj=smpl.data,
		                    	hlt.col.exist=T,hl.col.which=c(1,5,20),hl.col.fill=c('lightgreen','darkgreen','red'),hl.col.alpha=c(0.4,0.4,0.4),
		                    	hlt.row.exist=T,hl.row.which=c(1,2,5),hl.row.fill=c('skyblue','red','yellow'),hl.row.alpha=c(0.4,0.4,0.4)
                )
  ggTableDrawer(smpl.spec)

l
a5Again same issues as above.Do not really see when i would want to highlight so many rows and columns anyways.


Example 5 : Problem

As an example of a problem consider the case where columns and rows do not exist but highlight do :
l

	smpl.spec <- ggTableSpec(columns.exist=F,columns.txt=colnames(smpl.data),columns.font=rep('bold',ncol(smpl.data)),columns.col='blue',columns.fill='grey',columns.alpha=0.7,
		                      rows.exist=F,rows.txt=rownames(smpl.data),rows.font=rep('bold',10),rows.col='green',rows.fill='blue',rows.alpha=0.7,
		                      data.obj=smpl.data,
		                    	hlt.col.exist=T,hl.col.which=c(1,5,20),hl.col.fill=c('lightgreen','darkgreen','red'),hl.col.alpha=c(0.4,0.4,0.4),
		                    	hlt.row.exist=T,hl.row.which=c(1,2,5),hl.row.fill=c('skyblue','red','yellow'),hl.row.alpha=c(0.4,0.4,0.4)
                )
  ggTableDrawer(smpl.spec)

l
dd

Clearly there are many issues that still need to be cleared up,but for the purposes of replicating the basic results of the paper I will leave the functions as they are for now. Instead of having me fumble around, I wish that the ggplot2 package creator would add table plotting functions to his package !