Asset Pricing [Part 4a: Black Jensen Scholes]
The measurement error, which arises when estimates of true beta are used as explanatory variables in the cross sectional part of the two pass regression, can be circumvented by grouping stocks into diversified portfolios. Stocks are sorted into portfolios based on characteristics that should explain risk premia. The Black, Jensen Scholes (BJS henceforth) methodology uses individual stock betas to rank the universe of stocks we are interested in and can be generalised as follows.
Using the same dataset as before, a specific application of the BJS method follows.
[1] Sample data : All stocks on the SP 500 from 1995(beg) – 2012(end). Data availability issues restricts sample to 351 assets for the specified time period.
[2] Estimate a beta for each stock in the first 5-year regression window using time series data in excess form.
[3] Rank order all of the stock betas and form 10 portfolios. Portfolio#1 will contain 35 stocks associated with the highest estimated betas. Portfolio #10 will contain 36 assets with the lowest estimated betas.
[4] Compute each of the portfolio’s returns for each of the 12 months in the year directly following the first 5-year regression window.
[5] Move the 5-year regression window forward by one year and repeat steps 2-4 for this new subset of data across all regression windows.
[6] Now we have 13 regression windows with 10 portfolios in each of them.
[7] Join identically numbered portfolios across regression windows (i.e. Portfolio n in gression window i with Portfolio n in windows j,k,l,etc) to yield 10 portfolio time series .
[8] Estimate a time series regression of portfolio returns against excess market returns for the remaining monthly data in the data set.
[9] Estimate the ex-post security market line via a cross sectional regression of mean portfolio returns against portfolio betas estimated in the previous step.
The code for the BJS procedure follows:
#Black Jensen Scholes
BJS <- list()
  BJS$mkt.ex.ret <- as.matrix(exm.ret[(nrow(ex.ret)-155):nrow(ex.ret),])
  BJS$windows.loc.beg <- c(1,seq(12,144,by=12))
  BJS$windows.loc.end <- seq(60,204,by=12)
  BJS$port.beg <- seq(1,317,by=35)
  BJS$port.end <- seq(35,351,by=35)+c(rep(0,9),1)

  BJS$length.windows <- 5
	BJS$num.windows <- ((length(market.ret)/12))-BJS$length.windows
	BJS$windows <- list()

		for(i in 1:BJS$num.windows){
			BJS$windows[[i]]<-list()
			BJS$windows[[i]]$alpha.list <- NULL
			BJS$windows[[i]]$beta.list <- NULL
			BJS$windows[[i]]$portfolios <- NULL
			BJS$windows[[i]]$portfolios.mean <- NULL

			for(j in 1:ncol(stock.ret)){
				BJS$windows[[i]]$fit[[j]]<-lm(ex.ret[BJS$windows.loc.beg[i]:BJS$windows.loc.end[i],j]~exm.ret[BJS$windows.loc.beg[i]:BJS$windows.loc.end[i]])

				BJS$windows[[i]]$fit[[j]]$alpha <- coef(BJS$windows[[i]]$fit[[j]])[1]
			  BJS$windows[[i]]$fit[[j]]$beta <- coef(BJS$windows[[i]]$fit[[j]])[2]

				BJS$windows[[i]]$alpha.list <- rbind(BJS$windows[[i]]$alpha.list,BJS$windows[[i]]$fit[[j]]$alpha)
				BJS$windows[[i]]$beta.list <- rbind(BJS$windows[[i]]$beta.list,BJS$windows[[i]]$fit[[j]]$beta)

				BJS$windows[[i]]$fit[[j]]$alpha.p <- summary(BJS$windows[[i]]$fit[[j]])[[4]][7]
			  BJS$windows[[i]]$fit[[j]]$beta.p <- summary(BJS$windows[[i]]$fit[[j]])[[4]][8]

				BJS$windows[[i]]$fit[[j]]$rsquared <- summary(BJS$windows[[i]]$fit[[j]])[[9]]
			}
			rownames(BJS$windows[[i]]$alpha.list) <- colnames(monthly.ret)
			rownames(BJS$windows[[i]]$beta.list) <- colnames(monthly.ret)
		  colnames(BJS$windows[[i]]$alpha.list) <- 'alphas'
			colnames(BJS$windows[[i]]$beta.list) <- 'betas'

			BJS$windows[[i]]$matrix <- cbind(BJS$windows[[i]]$alpha.list,BJS$windows[[i]]$beta.list,t(stock.ret[(BJS$windows.loc.end[i]+1):(BJS$windows.loc.end[i]+12),1:351]))
			colnames(BJS$windows[[i]]$matrix)[3:14] <- month.abb
			BJS$windows[[i]]$matrix.sorted <- BJS$windows[[i]]$matrix[order(BJS$windows[[i]]$matrix[,2],decreasing=TRUE),]

			for(k in 1:10){
				BJS$windows[[i]]$portfolios[[k]] <- BJS$windows[[i]]$matrix.sorted[BJS$port.beg[k]:BJS$port.end[k],]
			  BJS$windows[[i]]$portfolios.mean[[k]] <- matrix(colMeans(BJS$windows[[i]]$portfolios[[k]][,3:14]),ncol=1)
			}
	}

BJS$port.ret.ts<- list()
for(a in 1:10){
 BJS$port.ret.ts[[a]]<-BJS$windows[[1]]$portfolios.mean[[a]]
	for(b in 2:BJS$num.windows){
		BJS$port.ret.ts[[a]]<-rbind(BJS$port.ret.ts[[a]],BJS$windows[[b]]$portfolios.mean[[a]])
	}
BJS$port.ret.ts.tot <- cbind(BJS$port.ret.ts.tot,BJS$port.ret.ts[[a]])
}

BJS$port.ret.ts.tot <-matrix(BJS$port.ret.ts.tot,ncol=10)
colnames(BJS$port.ret.ts.tot) <- paste('Portfolio',1:10)

BJS$port.reg <- lm(BJS$port.ret.ts.tot~BJS$mkt.ex.ret)
BJS$port.betas <- as.matrix(coef(BJS$port.reg)[2,])
BJS$port.alphas <- as.matrix(coef(BJS$port.reg)[1,])

BJS$port.alpha.p <- NULL
BJS$port.beta.p <- NULL
BJS$port.rsquared <- NULL

for(i in 1:10){
	BJS$port.alpha.p <- rbind(BJS$port.alpha.p,summary(BJS$port.reg)[[i]][[4]][7])
	BJS$port.beta.p <- rbind(BJS$port.beta.p,summary(BJS$port.reg)[[i]][[4]][8])
	BJS$port.rsquared <- rbind(BJS$port.rsquared,summary(BJS$port.reg)[[i]][[9]])
}

BJS$port.cor <- cor(BJS$port.ret.ts.tot,BJS$mkt.ex.ret)
BJS$port.res.std <- apply(resid(BJS$port.reg),2,sd)

BJS$port.cross.ret <- matrix(colMeans(BJS$port.ret.ts.tot))*100
BJS$port.cross.reg <- lm(BJS$port.cross.ret~BJS$port.betas)
gh
To visualise the results:
#Visualise BJS
dat <- rbind(t(BJS$port.alphas),t(BJS$port.alpha.p),t(BJS$port.betas),t(BJS$port.beta.p),t(BJS$port.cor),t(BJS$port.res.std),t(BJS$port.cross.ret))
tab<-cbind(c('Alpha','¬p-value','Beta','¬p-value','Cor(p,m)','Std(res)','AVG(ret)'),(round(dat,3)))
annot <- c(' ',paste('Portfolio ',1:10))

windows()
layout(matrix(c(1,2,2),nrow=3))
par(mai=c(0,0,0.2,0))
TableMaker(row.h=1,apply(tab,2,rev),annot,strip=F,strip.col=c('red','green'),col.cut=0,alpha=0.6,border.col='lightgrey',text.col='black',header.bcol='gold',header.tcol='black',title='Summary of statistics for time series regressions')

par(mai=c(0.55,0.55,0.3,0.25))
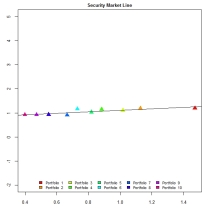
plot(ylim=c(-2,5),ylab='Average Excess Returns',xlab='Systematic Risk',pch=17,main='Security Market Line',x=BJS$port.betas,y=BJS$port.cross.ret,cex.main=0.85,cex.lab=0.8,cex.axis=0.8,col=rainbow(10),cex=1.5)
abline(BJS$port.cross.reg)

legend('bottom',fill=rainbow(10),legend=paste('Portfolio ',1:10),ncol=5,bg='white',bty='n',cex=0.7)
jj
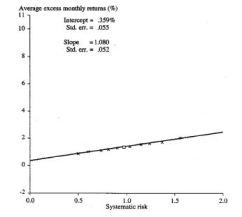
 The BJS method seems to do quite well for itself. While there is no way for me to confirm whether my code is correct, comparing my plot with one of the plots typically found for such studies does (especially if I use the same scale) appears to reveal some similarity.
Here is a snap shot of the original plot alongside my plot after adjusting the y-scales.


