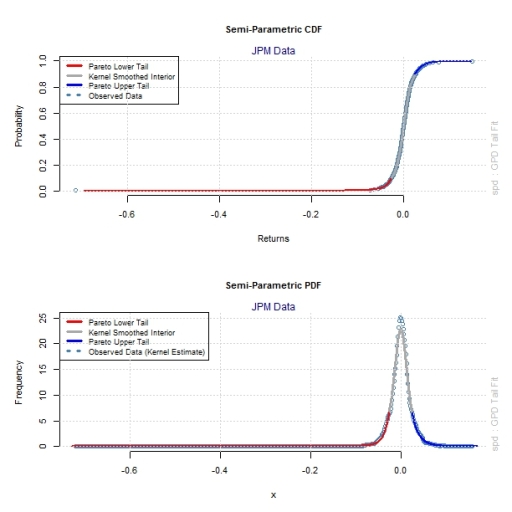
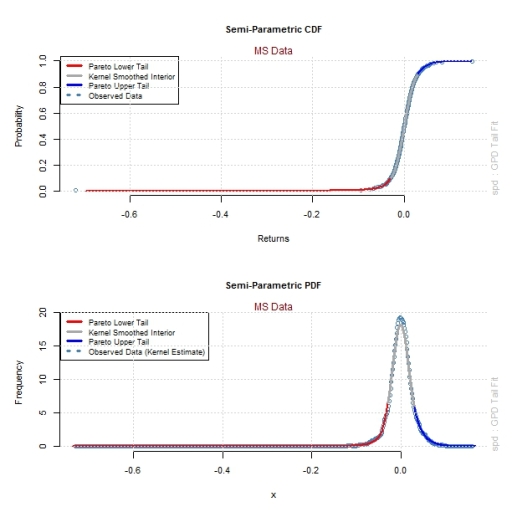
In the previous post we explored the univariate distribution of daily log returns for JPM and MS and concluded non normality for both, invalidating the correlation coefficient as a good measure of dependency between these financial assets. We proceeded to compare the joint distribution of stock returns with simulated joint distributions under a normality assumption. While the bi-variate normal distribution does a decent job in explaining the core of the joint distribution of asset returns, it fails to capture tail dependencies. This observation led us to fit a semi-parametric model to the data, where the tails of the distribution are modelled using a parametric GPD distribution while the core of the joint stock distribution is modelled using a non-parametric empirical distribution. From a visual inspection of the figures we concluded that the semi-parametric approach provides a better approximation for the actually observed joint distribution of stock returns than the bi-variate normal approach. In other words, simulating data from a fitted semi-parametric model can better explain the observed joint distribution of stock returns than simulated data from a bi-variate normal distribution.
Copulas are used to describe the dependence between random variables. Copulas are popular in statistical applications as they allow one to easily model and estimate the distribution of random vectors by estimating marginals and copula separately.
Click here for the Wikipedia entry
A flexible way to successfully model the joint behaviour of financial returns, after modelling the marginal distribution (as per previous post), is with copulas. Let’s first visualise the empirical joint distribution of daily log returns.
################################################################################
# Modelling Copula (Dependence structure between marginal distributions)
# ##############################################################################

# [1] Create the empirical copula for daily returns

   asset1.gpd<-pspd(ret.mat.nz[,1],semiparam.1.fit)
   asset2.gpd<-pspd(ret.mat.nz[,2],semiparam.2.fit)

   emp.cop.p<-pempiricalCopula(asset1.gpd,asset2.gpd,N=15)
   emp.cop.d<-dempiricalCopula(asset1.gpd,asset2.gpd,N=15)

   jet.colors <- colorRampPalette( c("red", "darkred") )
   nbcol <- 10
   color <- jet.colors(nbcol)

  windows()
   layout(matrix(c(1,2,3,4),nrow=2,ncol=2))
   par(mai=c(0.75,0.85,0.4,0.2))
   plot(cex.main=0.85,cex.lab=0.75,cex.axis=0.75,cex=0.85,asset1.gpd,asset2.gpd,xlab=paste("Univariate random variable from\n",ticker[1],"semiparametric GPD"),ylab=paste("Univariate random variable from\n",ticker[2],"semiparametric GPD"))
   par(mai=c(0.75,0.85,0.3,0.2))
   contour(col=color,emp.cop.p,xlab=ticker[1],ylab=ticker[2],cex.main=0.85,cex.lab=0.75,cex.axis=0.75,cex=0.85)
   par(mai=c(0.75,0.75,0.4,0.2))

   x <- emp.cop.d$x
   y <- emp.cop.d$y
   z <- emp.cop.d$z
   nrz <- nrow(z)
   ncz <- ncol(z)

   zfacet <- z[-1, -1] + z[-1, -ncz] + z[-nrz, -1] + z[-nrz, -ncz]
   facetcol <- cut(zfacet, nbcol)
   persp(xlab=ticker[1],ylab=ticker[2],shade=0.5,ticktype='simple',theta=-30,phi=30,expand=0.618,xlim=range(emp.cop.d$x),ylim=range(emp.cop.d$y),zlim=range(emp.cop.d$z),x=emp.cop.d$x,y=emp.cop.d$y,z=emp.cop.d$z,col=color[facetcol])

   par(mai=c(0.75,0.75,0.4,0.2))
   contour(col=color,xlab=ticker[1],ylab=ticker[2],emp.cop.d)
Created by Pretty R at inside-R.org
Now that we have visualised the joint distribution of asset returns, let’s proceed to find the Copula that best fits this observed structure. First let’s fit elliptical copulae (Gaussian, Student T, Cauchy) to the observed data and visualise the fit in 2 and 3 dimensions.
# [2] Fitting the empirical copula with parametric copulae

  n.obs<-nrow(ret.mat.nz)
  margin.data<-cbind(asset1.gpd,asset2.gpd)
  u=grid2d(x=emp.cop.p$x)

  # [2.a] Elliptical copulae

    Gauss.cop.fit<-ellipticalCopulaFit(margin.data[,1],margin.data[,2],type='norm')
    Gauss.r<-rellipticalCopula(n.obs,rho=Gauss.cop.fit$par,param=NULL,type='norm')
    Gauss.p<-pellipticalCopula(u,rho=Gauss.cop.fit$par,param=NULL,type='norm',output='list')
    Gauss.d<-dellipticalCopula(u,rho=Gauss.cop.fit$par,param=NULL,type='norm',output='list')

    g.sim.1<-qspd(Gauss.r[,1],semiparam.1.fit)
    g.sim.2<-qspd(Gauss.r[,2],semiparam.2.fit)

    Ts.cop.fit<-ellipticalCopulaFit(margin.data[,1],margin.data[,2],type='t')
    Ts.r<-rellipticalCopula(n.obs,rho=Ts.cop.fit$par[1],param=Ts.cop.fit$par[2],type='t')
    Ts.p<-pellipticalCopula(u,rho=Ts.cop.fit$par[1],param=Ts.cop.fit$par[2],type='t',output='list')
    Ts.d<-dellipticalCopula(u,rho=Ts.cop.fit$par[1],param=Ts.cop.fit$par[2],type='t',output='list')

    t.sim.1<-qspd(Ts.r[,1],semiparam.1.fit)
    t.sim.2<-qspd(Ts.r[,2],semiparam.2.fit)

    Cauchy.cop.fit<-ellipticalCopulaFit(margin.data[,1],margin.data[,2],type='cauchy')
    Cauchy.r<-rellipticalCopula(n.obs,rho=Cauchy.cop.fit$par[1],param=NULL,type='cauchy')
    Cauchy.p<-pellipticalCopula(u,rho=Cauchy.cop.fit$par[1],param=NULL,type='cauchy',output='list')
    Cauchy.d<-dellipticalCopula(u,rho=Cauchy.cop.fit$par[1],param=NULL,type='cauchy',output='list')

    c.sim.1<-qspd(Cauchy.r[,1],semiparam.1.fit)
    c.sim.2<-qspd(Cauchy.r[,2],semiparam.2.fit)

# Setting up the plot for Elliptical copulae

   windows(width=7,height=7)
    layout(matrix(c(1:16),nrow=4,ncol=4))

# Empirical Plots
    x <- emp.cop.d$x
    y <- emp.cop.d$y
    z <- emp.cop.d$z
    nrz <- nrow(z)
    ncz <- ncol(z)

    zfacet <- z[-1, -1] + z[-1, -ncz] + z[-nrz, -1] + z[-nrz, -ncz]
    facetcol <- cut(zfacet, nbcol)
    jet.colors <- colorRampPalette( c("red", "darkred") )
    nbcol <- 50
    color <- jet.colors(nbcol)

    par(mai=c(0,0.1,0.3,0.1))
    plot(main="Empirical",cex.main=0.85,cex.lab=0.75,cex.axis=0.75,cex=0.85,asset1.gpd,asset2.gpd,yaxt='n',xaxt='n',col="darkred")
    par(mai=c(0,0.1,0.05,0.1))
    contour(xaxt='n',yaxt='n',col="red",emp.cop.p,xlab=ticker[1],ylab=ticker[2],cex.main=0.85,cex.lab=0.75,cex.axis=0.75,cex=0.85)
    contour(xaxt='n',yaxt='n',col='darkred',emp.cop.d)
    persp(xlab='',ylab='',zlab='',xaxt='n',yaxt='n',shade=0.5,ticktype='simple',theta=-30,phi=30,expand=0.618,xlim=range(emp.cop.d$x),ylim=range(emp.cop.d$y),zlim=range(emp.cop.d$z),x=emp.cop.d$x,y=emp.cop.d$y,z=emp.cop.d$z,col=color[facetcol])

# Fitted Plots For Gaussian
    x <- Gauss.d$x
    y <- Gauss.d$y
    z <- Gauss.d$z
    nrz <- nrow(z)
    ncz <- ncol(z)

    zfacet <- z[-1, -1] + z[-1, -ncz] + z[-nrz, -1] + z[-nrz, -ncz]
    facetcol <- cut(zfacet, nbcol)
    jet.colors <- colorRampPalette( c("cyan", "darkblue") )
    nbcol <- 50
    color <- jet.colors(nbcol)

    par(mai=c(0,0.05,0.3,0.1))
    plot(main="Fitted-Gaussian",cex.main=0.85,cex.lab=0.75,cex.axis=0.75,cex=0.85,Gauss.r[,1],Gauss.r[,2],yaxt='n',xaxt='n',col="royalblue")
    par(mai=c(0,0.05,0.05,0.1))
    contour(xaxt='n',yaxt='n',col="royalblue",Gauss.p,xlab=ticker[1],ylab=ticker[2],cex.main=0.85,cex.lab=0.75,cex.axis=0.75,cex=0.85)
    contour(add=TRUE,labels='',lty='dashed',xaxt='n',yaxt='n',col="red",emp.cop.p,xlab=ticker[1],ylab=ticker[2],cex.main=0.85,cex.lab=0.75,cex.axis=0.75,cex=0.85)
    contour(xaxt='n',yaxt='n',col="royalblue",Gauss.d)
    contour(add=TRUE,labels='',xaxt='n',yaxt='n',col='darkred',emp.cop.d)
    persp(xlab='',ylab='',zlab='',xaxt='n',yaxt='n',shade=0.5,ticktype='simple',theta=-30,phi=30,expand=0.618,Gauss.d,col=color[facetcol])

# Fitted Plots for Student T

    x <- Ts.d$x
    y <- Ts.d$y
    z <- Ts.d$z
    nrz <- nrow(z)
    ncz <- ncol(z)

    zfacet <- z[-1, -1] + z[-1, -ncz] + z[-nrz, -1] + z[-nrz, -ncz]
    facetcol <- cut(zfacet, nbcol)
    jet.colors <- colorRampPalette( c("cyan", "darkblue") )
    nbcol <- 50
    color <- jet.colors(nbcol)

    par(mai=c(0,0.05,0.3,0.1))
    plot(main="Fitted-Student T",cex.main=0.85,cex.lab=0.75,cex.axis=0.75,cex=0.85,Ts.r[,1],Ts.r[,2],yaxt='n',xaxt='n',col="royalblue")
    par(mai=c(0,0.05,0.05,0.1))
    contour(xaxt='n',yaxt='n',col="royalblue",Ts.p,xlab=ticker[1],ylab=ticker[2],cex.main=0.85,cex.lab=0.75,cex.axis=0.75,cex=0.85)
    contour(add=TRUE,labels='',lty='dashed',xaxt='n',yaxt='n',col="red",emp.cop.p,xlab=ticker[1],ylab=ticker[2],cex.main=0.85,cex.lab=0.75,cex.axis=0.75,cex=0.85)
    contour(xaxt='n',yaxt='n',col="royalblue",Ts.d)
    contour(add=TRUE,labels='',xaxt='n',yaxt='n',col='darkred',emp.cop.d)
    persp(xlab='',ylab='',zlab='',xaxt='n',yaxt='n',shade=0.5,ticktype='simple',theta=-30,phi=30,expand=0.618,Ts.d,col=color[facetcol])

# Fitted Plots for Cauchy

x <- Cauchy.d$x
y <- Cauchy.d$y
z <- Cauchy.d$z
nrz <- nrow(z)
ncz <- ncol(z)

zfacet <- z[-1, -1] + z[-1, -ncz] + z[-nrz, -1] + z[-nrz, -ncz]
facetcol <- cut(zfacet, nbcol)
jet.colors <- colorRampPalette( c("cyan", "darkblue") )
nbcol <- 50
color <- jet.colors(nbcol)

par(mai=c(0,0.05,0.3,0.1))
plot(main="Fitted-Cauchy",cex.main=0.85,cex.lab=0.75,cex.axis=0.75,cex=0.85,Cauchy.r[,1],Cauchy.r[,2],yaxt='n',xaxt='n',col="royalblue")
par(mai=c(0,0.05,0.05,0.1))
contour(xaxt='n',yaxt='n',col="royalblue",Cauchy.p,xlab=ticker[1],ylab=ticker[2],cex.main=0.85,cex.lab=0.75,cex.axis=0.75,cex=0.85)
contour(add=TRUE,labels='',lty='dashed',xaxt='n',yaxt='n',col="red",emp.cop.p,xlab=ticker[1],ylab=ticker[2],cex.main=0.85,cex.lab=0.75,cex.axis=0.75,cex=0.85)
contour(xaxt='n',yaxt='n',col="royalblue",Cauchy.d)
contour(add=TRUE,labels='',xaxt='n',yaxt='n',col='darkred',emp.cop.d)
persp(xlab='',ylab='',zlab='',xaxt='n',yaxt='n',shade=0.5,ticktype='simple',theta=-30,phi=30,expand=0.618,Cauchy.d,col=color[facetcol])

# comparing actual with simulated data
windows()
par(mfrow=c(2,3),mar=c(6,4,5,0.5))

plot(ylim=c(x_min,x_max),xlim=c(x_min,x_max),xlab=ret.unl[1],ylab=ret.unl[2],x=ret.mat.nz[,1],y=ret.mat.nz[,2],pch=1,col="darkred",cex.main=0.95,cex.lab=0.95,cex=0.95,cex.axis=0.95,main=paste("Empirical data with rho of\n ",emp.corr))
grid()
abline(h=0,v=0,col="black")

plot(ylim=c(x_min,x_max),xlim=c(x_min,x_max),xlab=paste("Simulated ",ret.unl[1]),ylab=paste("Simulated ",ret.unl[2]),x=simulated.ret[,1],y=simulated.ret[,2],pch=1,col="darkblue",cex.main=0.95,cex.lab=0.95,cex=0.95,cex.axis=0.95,main="Simulated data from \n Bivariate Normal Distribution")
grid()
abline(h=0,v=0,col="black")

plot(ylim=c(x_min,x_max),xlim=c(x_min,x_max),xlab=colnames(semiparametric.sim.ret)[1],ylab=colnames(semiparametric.sim.ret)[2],cex.main=1,cex=1,cex.lab=0.95,cex.axis=0.85,x=semiparametric.sim.ret[,1],y=semiparametric.sim.ret[,2],main=paste("Simulated Return Data From \n","Semiparametric GPD"),col='darkblue',pch=10)
abline(h=0,v=0)
grid()

plot(x=g.sim.1,y=g.sim.2,xlab=paste("Simulated",ret.unl[1]),ylab=paste("Simulated ",ret.unl[2]),main="Simulated data using \n Gaussian Copula",col="darkblue",pch=1,cex.main=0.95,cex.lab=0.95,cex=0.95,cex.axis=0.95)
grid()
abline(h=0,v=0,col="black")

plot(x=t.sim.1,y=t.sim.2,xlab=paste("Simulated",ret.unl[1]),ylab=paste("Simulated ",ret.unl[2]),main="Simulated data using \n Student T Copula",col="darkblue",pch=1,cex.main=0.95,cex.lab=0.95,cex=0.95,cex.axis=0.95)
grid()
abline(h=0,v=0,col="black")

plot(x=c.sim.1,y=c.sim.2,xlab=paste("Simulated",ret.unl[1]),ylab=paste("Simulated ",ret.unl[2]),main="Simulated data using \n Cauchy Copula",col="darkblue",pch=1,cex.main=0.95,cex.lab=0.95,cex=0.95,cex.axis=0.95)
grid()
abline(h=0,v=0,col="black")
Created by Pretty R at inside-R.org
While the red plots in the figure are representations of the empirical bi-variate distribution of asset returns, the blue plots represent the different elliptical copulae fitted to the data. Clearly, the greater the alignment between the empirical contours and the model (red vs blue lines in the midsection of the figure), the greater the fit of the model. Both the Gaussian and the Student T copulae appear to provide a decent fit to the data. Another way to visualise this is to plot the joint distribution of stock returns and compare it against simulated data under different assumptions.
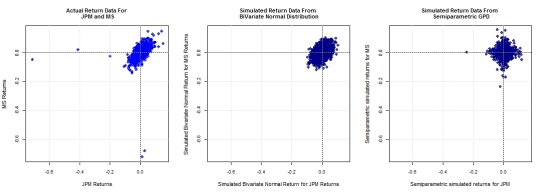
The figure above provides a simple summary of the main findings so far.
[1] From an empirical plot of MS returns against JPM returns, we can deduce that the joint distribution is centered around 0 but has tail dependencies not captured by a joint normal distribution, a typical assumption imposed by financial theories on asset returns.
[2] If we had imposed a normality assumption on financial asset returns and simulated from this bi-variate distribution, we would be in the position of the second plot. Clearly, modelling the empirical joint distribution (red) using a bi-variate normal distribution understates the tail dependencies.
[3] To capture the tail dependencies while preserving the ability of the joint normal distribution to explain the core of the actual returns distribution,we fitted a semi-parametric model : GPD in the tails and empirical in the centre. This puts us in the position of the third plot, which is a bit better at explaining tail behaviour than the bi-variate normal distribution but not by much.
[4] While the GPD may capture tail behaviour of marginal distributions, the implicit copula does not capture the observed tail dependencies of the data set. Instead of relying on the implicit copula for the dependency structure, we fitted a variety of elliptical copulae to the data set, placing us in the position of plots 4-6, which are clearly an improvement on previous simulations.


