Following the simple introduction to EVT in the previous post, let’s proceed to apply the maxima and threshold models to the SP 500 data set. First, let’s download the prices for ^GSPC from 1960 to 1987 and calculate arithmetic returns. Then we shall plot the price and returns data as well as the empirical density along with a simulated normal distribution.
# Download the data and draw price/return charts
ticker<-c('^GSPC')
symbols<-unlist(strsplit(ticker,split=","))
beg<-'1960-01-05'
ed<-'1987-10-16'
ret.type='arithmetic'

getSymbols(symbols[1],from=as.Date(beg),to=as.Date(ed))
price.mat<-GSPC[,4]
p.n.obs<-nrow(price.mat)
ret.mat<-as.timeSeries(dailyReturn(price.mat,type=ret.type)*100)
# ret.mat<-as.timeSeries(tail(diff(log(GSPC[,4])),-1)*100)
colnames(ret.mat)<-c("S+P500 Returns")

# Plot Series
windows()
layout(c(1,2,3))
par(mai=c(0.3,0.5,0.2,0.5))
plot(price.mat,cex=0.7,cex.axis=0.9,cex.lab=1,cex.main=0.7,xlab='',main='')
grid()
mtext(side=4,text="Daily Closing prices",outer=FALSE,col='black',cex=0.85,font=2,padj=0,adj=0)
par(mai=c(0.5,0.5,0.2,0.5))
plot(ret.mat,cex=0.7,cex.axis=0.9,cex.lab=1,cex.main=0.7,ylab='',col='darkblue',font.axis=2,xlab='',main='')
grid()
abline(h=0)
mtext(side=4,text="Daily returns",outer=FALSE,col='darkblue',cex=0.85,font=2,padj=0,adj=0)
plot(xlab='',main='',density(ret.mat),cex=0.7,cex.axis=0.9,cex.lab=1,cex.main=0.7,ylab='',col="darkblue",lwd=2)
legend(horiz=F,bty='n',"topright",fill=c("darkblue","darkred"),legend=c(symbols[1],"Normal"))
grid()
lines(density(rnorm(300000,mean=0,sd=1)),col='darkred',lwd=1.5)
mtext(side=4,text="Distributions",outer=FALSE,col='darkblue',cex=0.85,font=2,padj=0,adj=0)
Created by Pretty R at inside-R.org
From a visual inspection of the last plot, we can see that the GSPC data is non normally distributed with excess kurtosis and a very mild skewness. We could, if we so wished, conduct statistical tests such as the Kolmogorov-Smirnov test (K-S) and Shapiro-Wilk (S-W) test as well as the Jacque Berra test to determine the extent and significance of non normality in the data set.
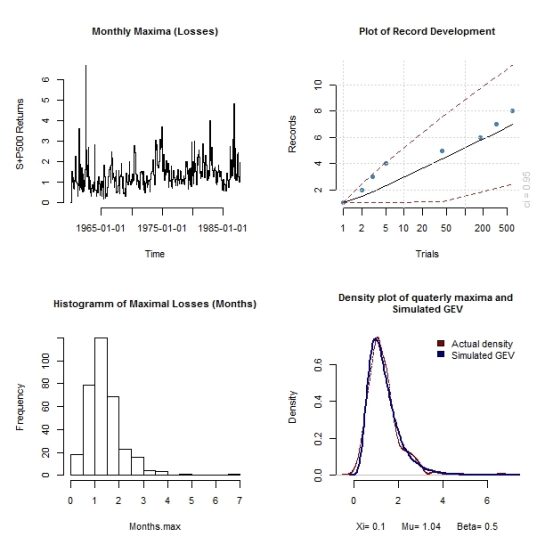
Having established the non-normality of the data set, let’s proceed with fitting the maxima model to the data and run some diagnostic tests to ascertain suitability. I have used quarterly and monthly blocks in the fitting process.
# Block maxima
# Quarters

GEV.Quarters<-gevFit(-ret.mat,block='quarterly')
tstamp<-timeSequence(from=as.Date('1960-01-05'),to=as.Date('1987-10-16'),by="quarter")
Quarters.max<-aggregate(-ret.mat,tstamp,max)
Quarters.sort<-sort(seriesData(Quarters.max))

xi.q<-GEV.Quarters@fit$par.ests[1]
mu.q<-GEV.Quarters@fit$par.est[2]
beta.q<-GEV.Quarters@fit$par.ests[3]

Quarters.fitplot<-gevSim(model=list(xi=xi.q,mu=mu.q,beta=beta.q),n=100000)

windows()
layout(matrix(c(1,2,3,4),nrow=2,ncol=2))
par(mai=c(0.75,0.75,0.7,0.3),cex.main=0.85,cex.lab=0.85,cex=0.75,cex.axis=0.85,bty='n')
plot(Quarters.max,type='s',main="Quarters Maxima (Losses)")
hist(Quarters.max,main="Histogramm of Maximal Losses (Quarters)")
recordsPlot(-ret.mat)
plot(density(Quarters.max),main='Density plot of quaterly maxima and \n Simulated GEV ',type='p',col="darkred",cex=0.2,xlab=paste("Xi=",round(xi.q,2)," Mu=",round(mu.q,2)," Beta=",round(beta.q,2)))
lines(density(Quarters.fitplot),type='l',col="darkblue",lwd=2)
legend(cex=0.85,bty='n',"topright",fill=c("darkred","darkblue"),legend=c("Actual density","Simulated GEV"))

# Diagnostics
windows()
layout(matrix(c(1,2,3,4),nrow=2,ncol=2))
par(mai=c(0.75,0.75,0.7,0.3),cex.main=0.85,cex.lab=0.85,cex=0.75,cex.axis=0.85,bty='n')
for(i in 1:4){
  plot(GEV.Quarters,which=i)
}

# Probability of next quarters Maximal loss exceeding all past maxima
Quarters.prob<-1-pgev(max(GEV.Quarters@fit$data),xi=xi.q,mu=mu.q,beta=beta.q)
cat('The probability of next quarters maximal loss exceeding all past maxima is : \n',round(Quarters.prob*100,2)," Percent")

# Monthly
GEV.Monthly<-gevFit(-ret.mat,block='monthly')
tstamp<-timeSequence(from=as.Date('1960-01-05'),to=as.Date('1987-10-16'),by="month")
Months.max<-aggregate(-ret.mat,tstamp,max)
Months.sort<-sort(seriesData(Months.max))

xi.m<-GEV.Monthly@fit$par.ests[1]
mu.m<-GEV.Monthly@fit$par.est[2]
beta.m<-GEV.Monthly@fit$par.ests[3]

Months.fitplot<-gevSim(model=list(xi=xi.m,mu=mu.m,beta=beta.m),n=100000)

windows()
layout(matrix(c(1,2,3,4),nrow=2,ncol=2))
par(mai=c(0.75,0.75,0.7,0.3),cex.main=0.85,cex.lab=0.85,cex=0.75,cex.axis=0.85,bty='n')
plot(Months.max,type='s',main="Monthly Maxima (Losses)")
hist(Months.max,main="Histogramm of Maximal Losses (Months)")
recordsPlot(-ret.mat)
plot(density(Months.max),main='Density plot of quaterly maxima and \n Simulated GEV ',type='p',col="darkred",cex=0.2,xlab=paste("Xi=",round(xi.m,2)," Mu=",round(mu.m,2)," Beta=",round(beta.m,2)))
lines(density(Months.fitplot),type='l',col="darkblue",lwd=2)
legend(cex=0.85,bty='n',"topright",fill=c("darkred","darkblue"),legend=c("Actual density","Simulated GEV"))

# Diagnostics
windows()
layout(matrix(c(1,2,3,4),nrow=2,ncol=2))
par(mai=c(0.75,0.75,0.7,0.3),cex.main=0.85,cex.lab=0.85,cex=0.75,cex.axis=0.85,bty='n')
for(i in 1:4){
  plot(GEV.Monthly,which=i)
}

# Probability of next months Maximal loss exceeding all past maxima
Months.prob<-1-pgev(max(GEV.Monthly@fit$data),xi=xi.m,mu=mu.m,beta=beta.m)
cat('The probability of next months maximal loss exceeding all past maxima is : \n',round(Months.prob*100,2)," Percent")
Created by Pretty R at inside-R.org
From the diagnostic plots we can see that using monthly rather than the quarterly blocks results in a better fit for the maxima model. From the console output ,the probability of next quarters maximal loss exceeding all past maxima is 0.33 Percent.The probability of next months maximal loss exceeding all past maxima is 0.05 Percent, attesting to how rare extreme events actually are.


